Consumer Theory Quiz

© 1998 Douglas H. Blair
1) When the price of gasoline falls or rises, consumers respond by changing the quantity of gasoline they purchase. The part of this change in quantity demanded known as the income effect refers to consumers' response to:

(a) the change in their money incomes.
(b) a change in their preferences.
(c) the induced change in their purchasing power.
(d) the change in the relative prices of goods.


2) At the point of tangency between the budget line and an indifference curve,

a) the rate at which the consumer is willing to substitute B for A equals the rate at which the consumer is able to substitute B for A, holding expenditure constant.
b) expenditure on good A is equal to expenditure on good B.
c) the income effect is equal to the substitution effect.
d) the consumer has reached the unique point at which total expenditure on A and B equals income.


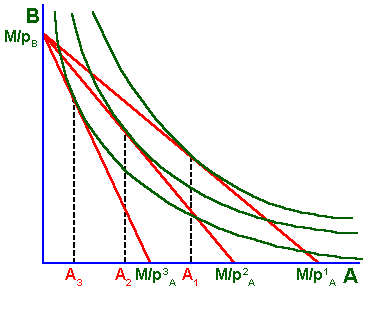
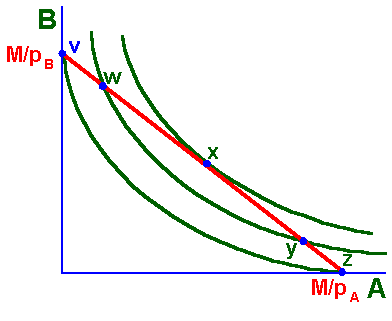
3) The diagram at right shows three budget lines and three indifference curves for a consumer. When the price of A changes from PA3 to PA2,

a) the quantity demanded of A decreases from A2 to A3.
b) the quantity demanded of A increases from A3 to A2.
c) the quantity demanded of A increases from M/PA3 to M/PA2.
d) the quantity demanded of A decreases from M/PA2 to M/PA3.


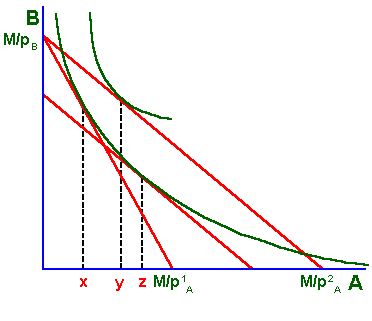
4) For the consumer whose preferences are shown in the diagram at right, the income effect of a change in the price of A from PA1 to PA2 is given by

a) y
b) y - x
c) z - x
d) z - y


5) For the consumer whose preferences are shown in the diagram at right, the difference y - x represents:

a) the elasticity of demand of A calculated using the midpoint formula and the two prices PA1 and PA2.
b) the total effect on quantity demanded of A caused by a change in the price of A from PA1 to PA2.
c) the income effect on quantity demanded of A caused by a change in the price of A from PA1 to PA2.
d) the substitution effect on quantity demanded of A caused by a change in the price of A from PA1 to PA2.


6) For the consumer whose preferences are illustrated in the diagram at right, commodity A:

a) is a normal good whose demand curve slopes downward.
b) is a normal good whose demand curve slopes upward.
c) is an inferior good whose demand curve slopes downward.
d) is an inferior good whose demand curve slopes upward.


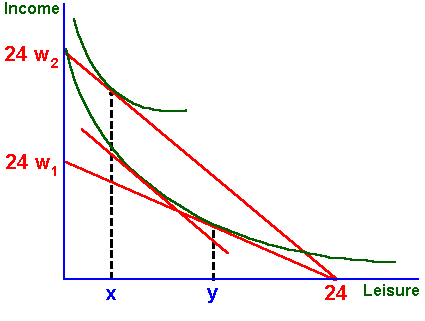
7) For the consumer whose preferences are illustrated in the diagram at right:

a) the supply of labor is downward-sloping and leisure is an inferior good.
b) the supply of labor is upward-sloping and leisure is an inferior good.
c) the supply of labor is downward-sloping and leisure is a normal good.
d) the supply of labor is upward-sloping and leisure is a normal good.


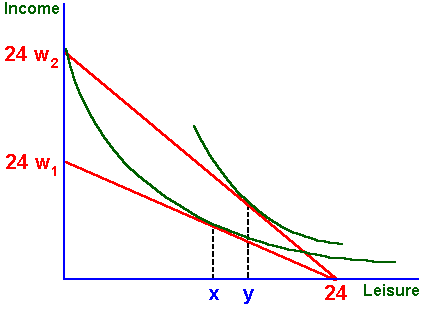
8) For the consumer whose preferences are illustrated in the diagram at right:

a) an increase in the wage rate increases hours worked.
b) an increase in the wage rate decreases hours worked.
c) leisure is an inferior good.
d) an increase in the wage rate lowers the opportunity cost of leisure.


9) Empirical evidence suggests that most commodities, including leisure, are normal goods. It is very unlikely that a good purchased by consumers has a positively sloped demand curve, yet it would not be surprising to find a "backward-bending" supply curve for labor. The reason these cases are different is that:
a) consumer theory is only intended to explain purchasing behavior for goods that consumers buy, not the ones they sell.
b) in the labor-supply context, the magnitude of the substitution effect is smaller than the income effect.
c) in the labor-supply context, the income and substitution effects usually have opposite signs.
d) in the labor-supply context, the substitution effect is positive at some wage rates and negative at others.


10) The number of units of B this consumer would give up for an additional unit of A is greater than the opportunity cost of A at the point:

a) w
b) x
c) y
d) z

Quiz powered by
Website Abstraction